Documentation Index
Fetch the complete documentation index at: https://docs.coval.dev/llms.txt
Use this file to discover all available pages before exploring further.
Analytics Dashboard for Voice AI
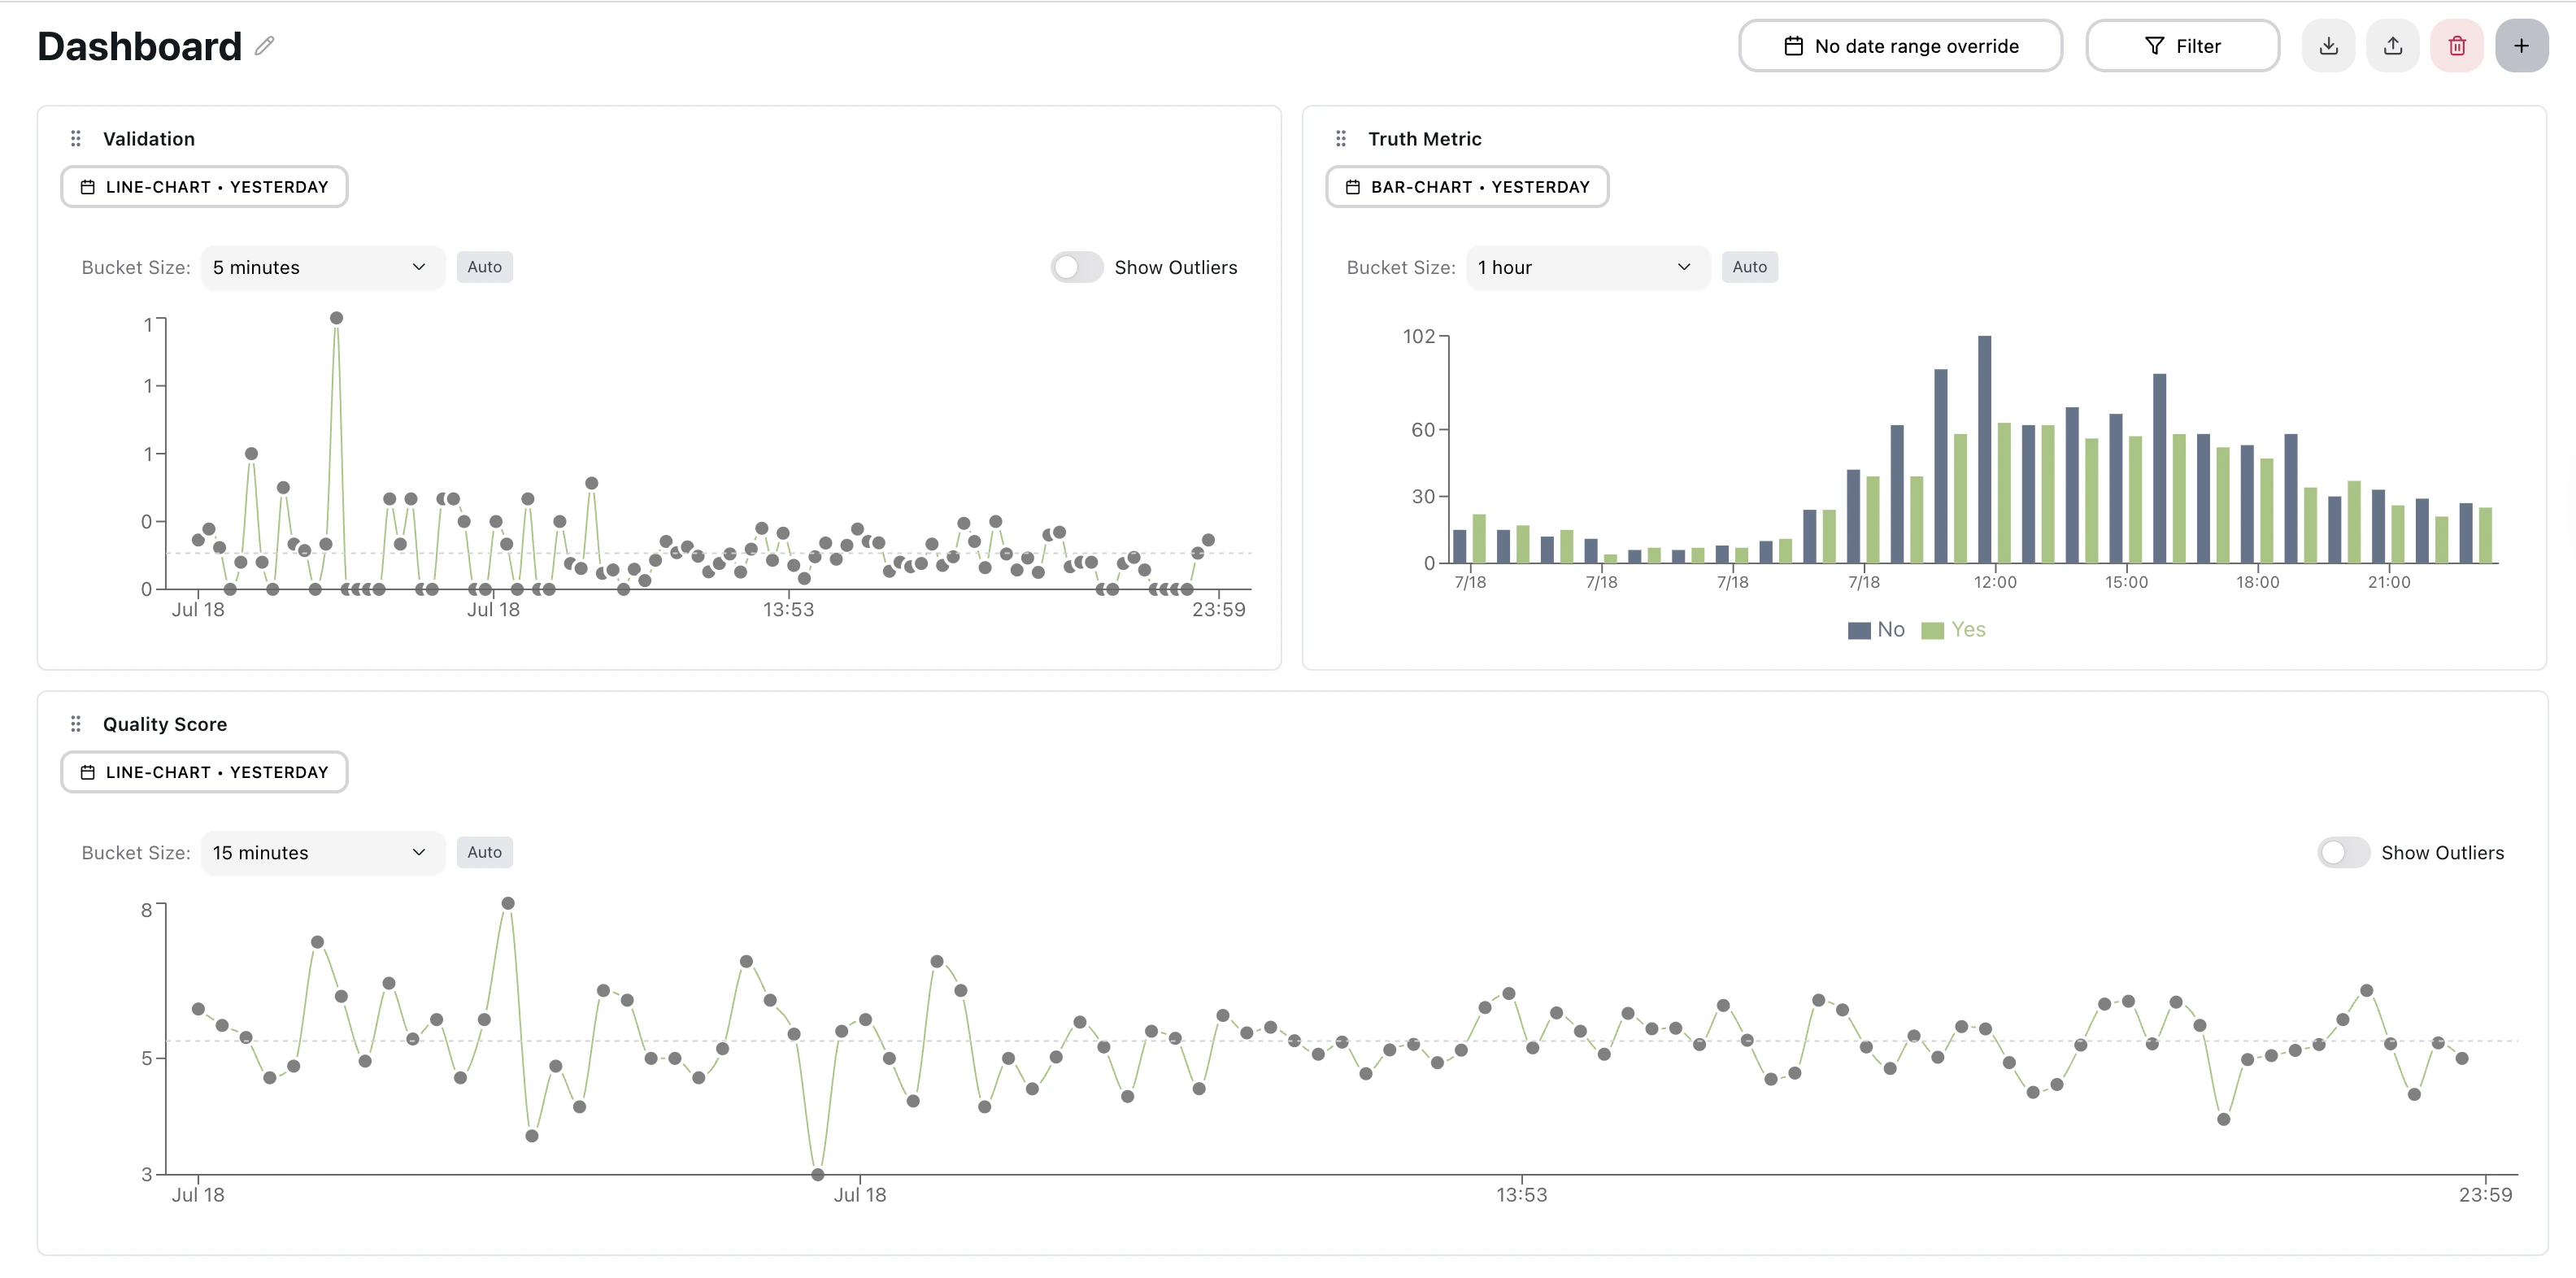
Flexible Dashboard
- Multiple Configurable Dashboards: Organize and switch between dashboards instantly to monitor different aspects of your voice AI system
- Intuitive Layout: Rearrange widgets, automatically adapts to any screen size, resize widgets, and automatically saved
Widget Configuration with Live Preview

- Choose from all available metrics on Coval’s platform
- See your changes applied immediately in the live preview pane
- Filter widgets by specific agent IDs for focused monitoring
- Add multiple aggregation dimensions (Agent + Persona combinations)
Widget Library
Bar Charts
- Compare performance across categories with regular or stacked visualizations
- Perfect for analyzing success rates, error distributions, or agent performance comparisons
- Smart color-coding for binary metrics (Yes/No scenarios)
Line Charts
- Track trends over time with multi-series support
- Built-in outlier detection to quickly spot anomalies
- Ideal for monitoring response times, call volumes, or quality scores
Area Charts
- Stacked area charts for visualizing cumulative trends over time
- Multi-series support with configurable fill opacity
- Percentage mode: Toggle “Show as percentage” to normalize stacked series to 100% for share-of-whole analysis
- Drag to zoom: Click and drag across any time range to zoom in; click the reset button to return to the full range
- Custom X and Y axis labels supported
Pie / Donut Charts
- Donut-style chart for visualizing proportional breakdowns across metric output values or groups
- Interactive slices — click any slice to drill down into the individual runs behind that segment
- Auto-generated legend with smart grid layout for large numbers of categories
- Color-coded by value or split dimension (agent, persona, etc.)
Statistic
Display a single aggregated metric value as a large, prominent number — ideal for KPI summaries and at-a-glance health checks.- Supports avg, sum, count, min, max aggregation modes
- Shows supporting statistics: sample count (n=), standard deviation (σ), and min/max range
- Optional box plot overlay shows the distribution of values alongside the headline number
- Grouped mode: When split by agent, persona, or template, renders a grid of stat cards — one per group — with density-adaptive layout (normal / compact / dense) based on widget size
Top List
- Horizontal bar chart showing the top 10 values ranked by metric score
- Ideal for surfacing best/worst performing agents, personas, or string metric outcomes
- Supports click-through drill-down to the underlying runs
- Color-coded using your metric’s custom color map or target condition values
Histogram
- Distribution chart showing how frequently metric values fall into each value bucket
- Useful for understanding spread and outliers in numeric metrics (e.g., latency, duration, scores)
- Automatically calculates bin sizes based on the data range
- Click any bin to drill down into the runs in that value range
Table
- Tabular view of metric data, sortable by column
- Shows one row per time bucket or group dimension
- Useful for detailed audits and exporting raw metric values alongside metadata
Text
- Display static text or notes anywhere on the dashboard
- Use for section headers, instructions, or annotations alongside metric widgets
- No data source required — purely presentational
Human Review Management
Monitor and manage your human review assignees directly from the dashboard. These widgets give you a centralized view of review progress and activity across all your projects.Threshold / Target Zone Visualization
Display your org-level metric thresholds directly on dashboard charts to quickly assess whether performance is within acceptable bounds.- Enable it: Toggle “Show target zone” in the widget configuration panel for success rate bar or average line chart widget
- Line charts: renders a shaded “fail zone” above or below the threshold line, making out-of-range periods immediately visible
- Bar charts: renders a dashed reference line at the threshold value for at-a-glance comparison against each bar
- The threshold value is pulled automatically from the custom threshold set in the metrics page
Question Monitoring
- Track unanswered questions and conversation gaps
- Identify areas where your AI needs improvement
- Monitor user satisfaction and engagement patterns
Filtering & Analysis
Multi-Dimensional Aggregation
- Agent-Level Analysis: Compare performance across different AI agents
- Persona-Based Insights: Analyze how different conversational personas perform
- Combined Analysis: Mix and match agents and personas for comprehensive views
- Binary Metric Support: Automatic Yes/No breakdowns for quality metrics
Intelligent Date Range Management
- Per-Widget Control: Set different time periods for each widget
- Global Overrides: Apply date ranges across all widgets instantly
- Smart Presets: Today, Yesterday, Last 7/30/90 days, Year-to-date
- Custom Ranges: “Last N days/weeks/months” or specific date periods
Metadata Filtering
Filter your dashboard data using custom metadata fields attached to your simulations or live calls. This allows you to segment your analytics by any attributes you track—such as customer tier, campaign ID, region, or experiment variant.Metadata filters work with any key-value pairs you’ve included in your
simulation or conversation data. Values are matched exactly, and multiple
filters are combined with AND logic.
- Key Selection: Choose from existing metadata keys or enter a custom key name
- Value Filtering: Select from suggested values or type your own custom value
- Search Support: Quickly find values by typing—results filter as you type
- Multiple Filters: Add several metadata filters to narrow down your analysis
- Compare performance across different customer segments
- Analyze A/B test results by experiment variant
- Filter by deployment environment (staging vs. production)
- Segment by geographic region or language
Test Case Filtering
Filter widget data by specific test cases to isolate performance on a particular subset of scenarios.- Select one or more test cases from any test set connected to your simulations
- Combine with agent, persona, and metadata filters for precise segmentation
- Useful for regression tracking on a fixed set of canonical test inputs
Powerful Filtering Options
- Filter by agent types, conversation attributes, metadata fields, and test cases
- Real-time filter application without page refresh
- Save and reuse common filter combinations
Deep Dive Analysis
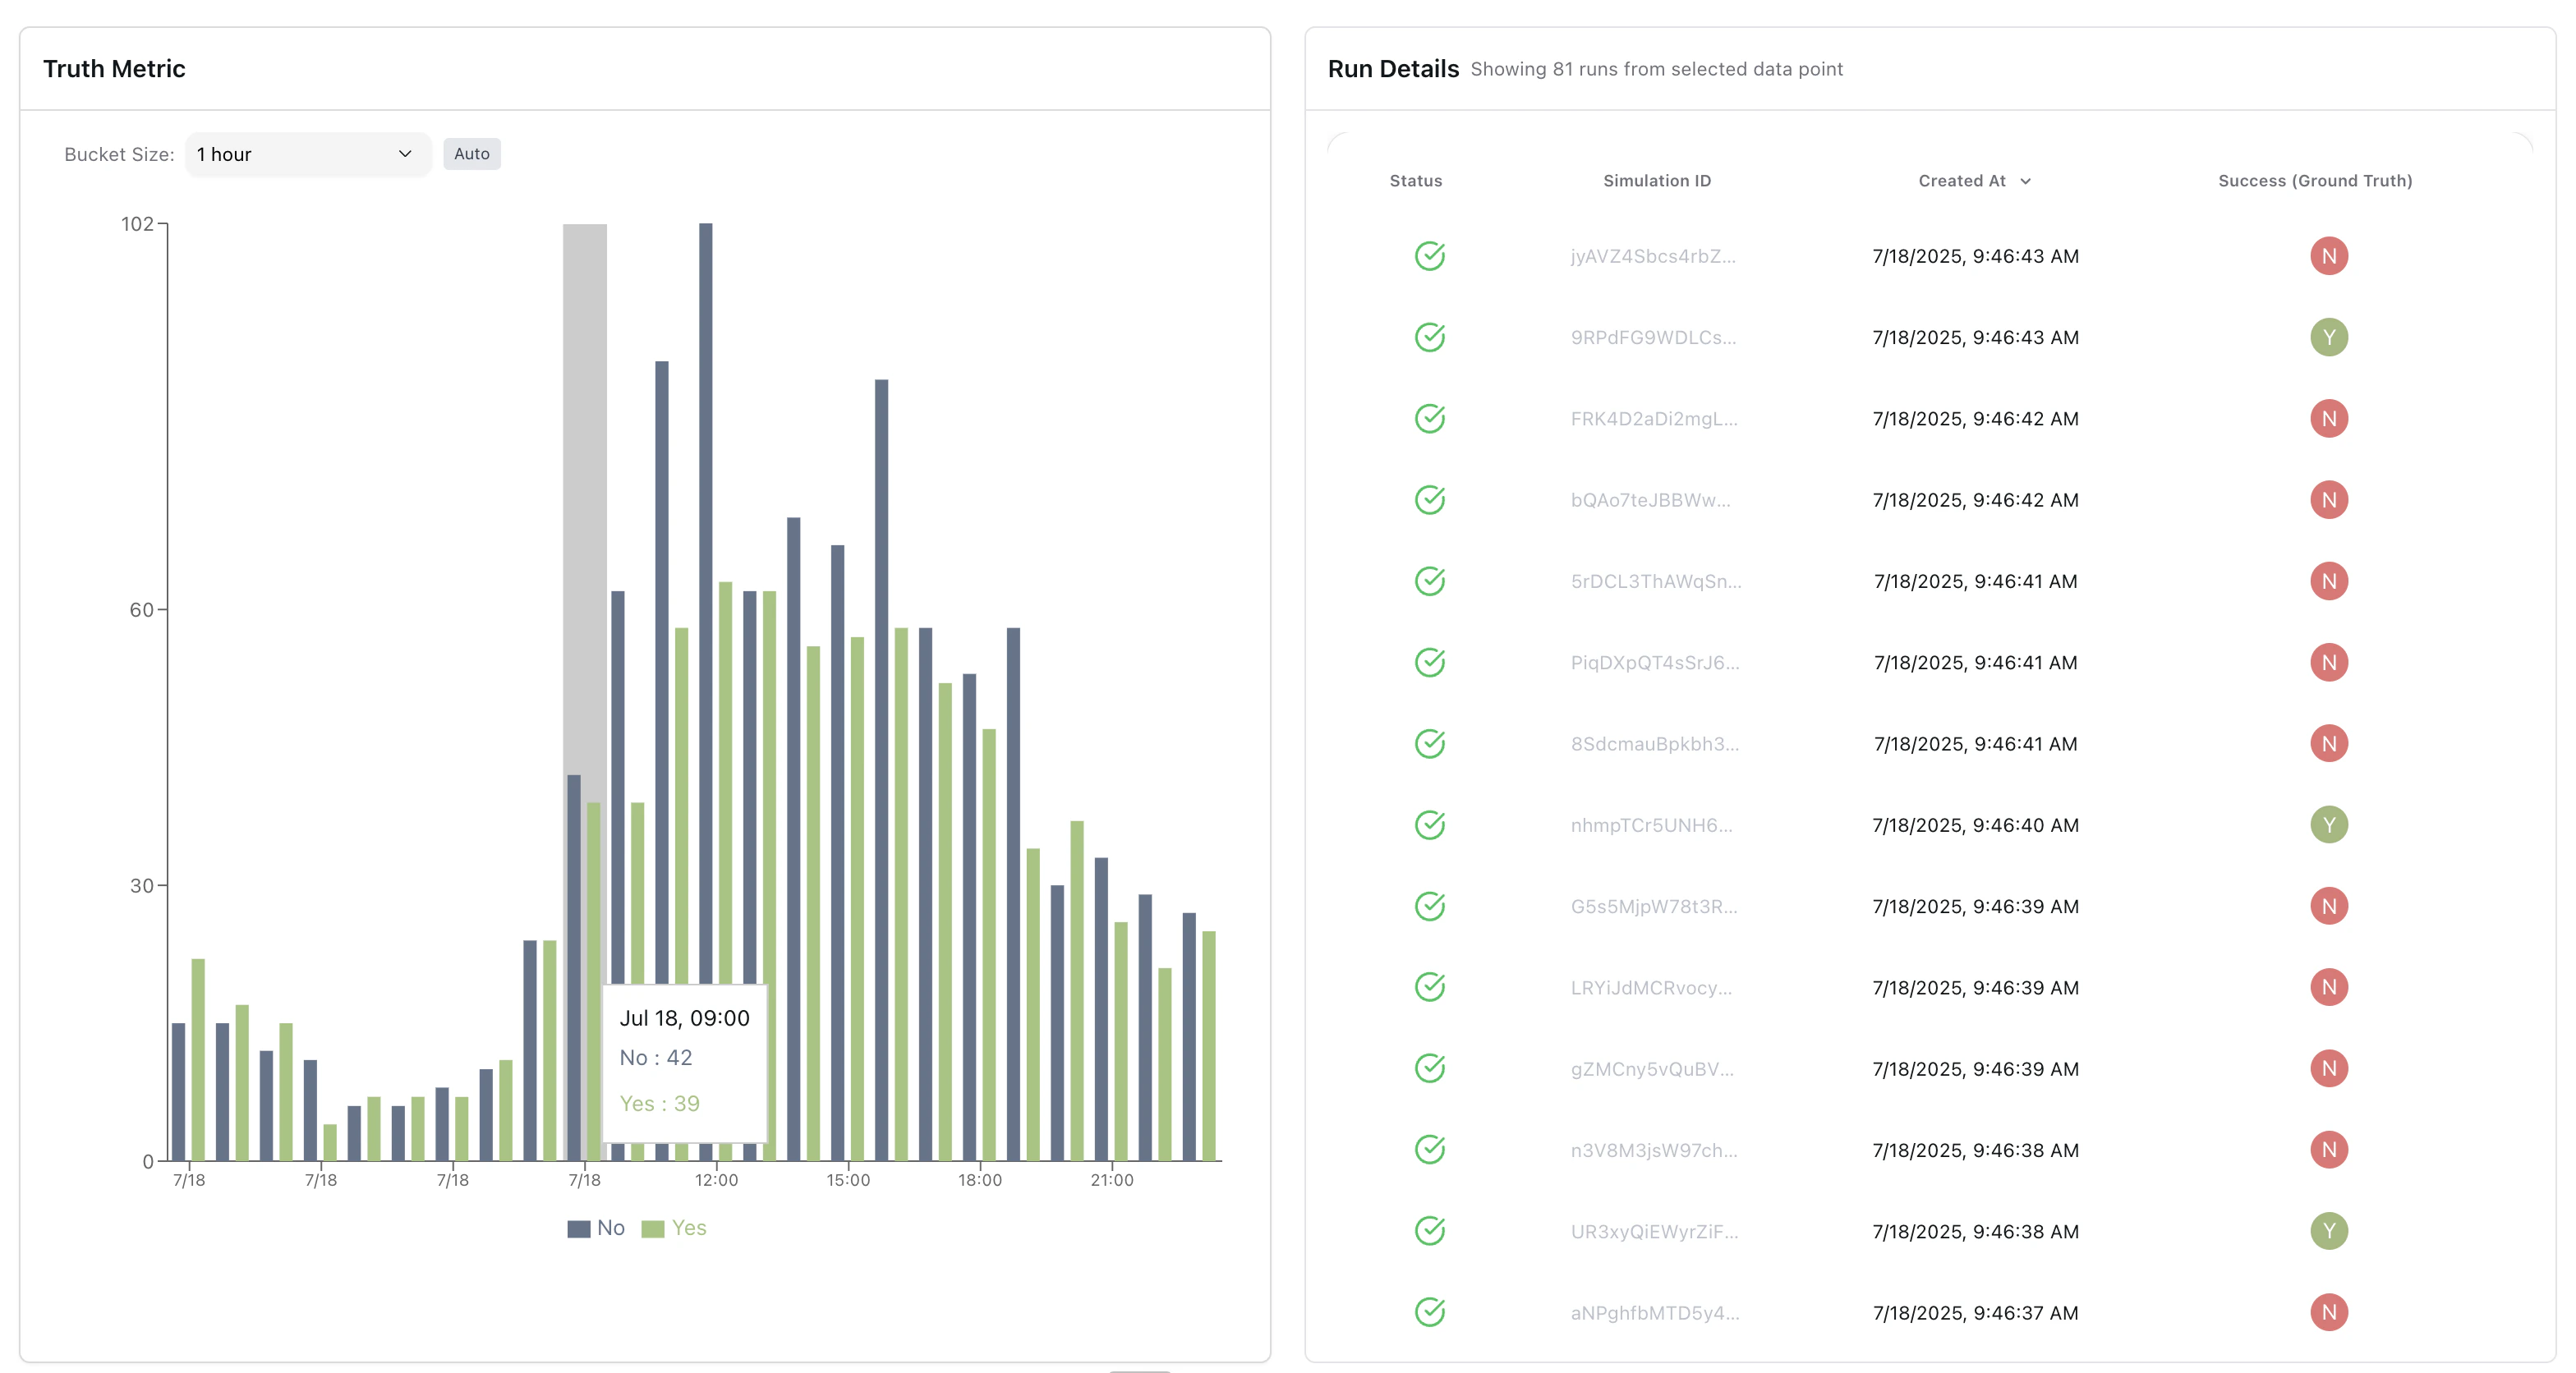
Focus Mode
- Click any data point to enter full-screen analysis mode
- 50/50 split view: chart on left, detailed run data on right
- Seamless transition back to overview dashboard
Run Details Investigation
- Drill down from aggregate charts to individual conversation data
- See exactly which calls contributed to each data point
- Investigate outliers and anomalies at the source level
- Full context for root cause analysis
CSV Export
Export drill-down data directly from the run details panel.- Internal links: Generates links accessible to logged-in team members
- Shareable links: Makes the linked simulations public so you can share them externally
- Exports all visible columns including metric values, timestamps, and run metadata
Smart Data Bucketing
- Automatic time bucket optimization based on data density
- Calendar-aware grouping (hours, days, weeks, months)
- Timezone-aware calculations for accurate reporting
Alerts from Widgets
Create a monitor directly from any metric widget without leaving the dashboard. Click the bell icon on a widget and configure:- Monitor name: Label for the alert
- Threshold: The value that triggers the alert (GT, GTE, LT, LTE, or EQ)
- Run types: Apply the monitor to simulation runs, monitoring runs, or both